Product Guides
Create a visualization and compare two years
Visualizations live inside a footprint project and turn your data into charts and pivot tables. This guide shows how to open them, add a new one, and set it up to compare two years side by side.
Before you start
You need an Editor role in your Dcycle organization.
Steps
Step 1
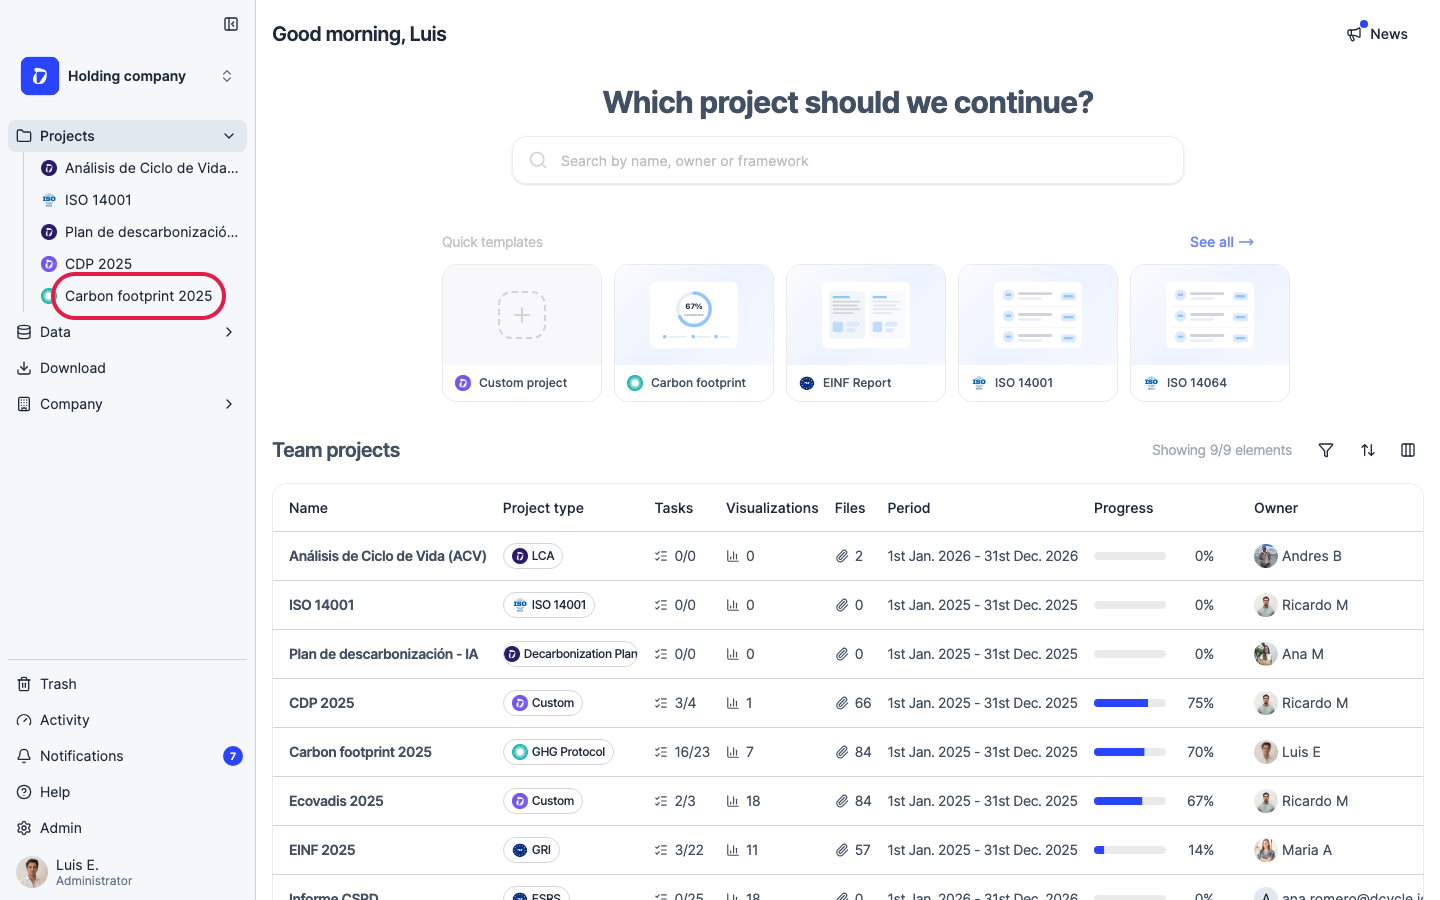
Open a footprint project from the left navigation (here “Carbon footprint 2025”). Visualizations are scoped to a single project.
Step 2
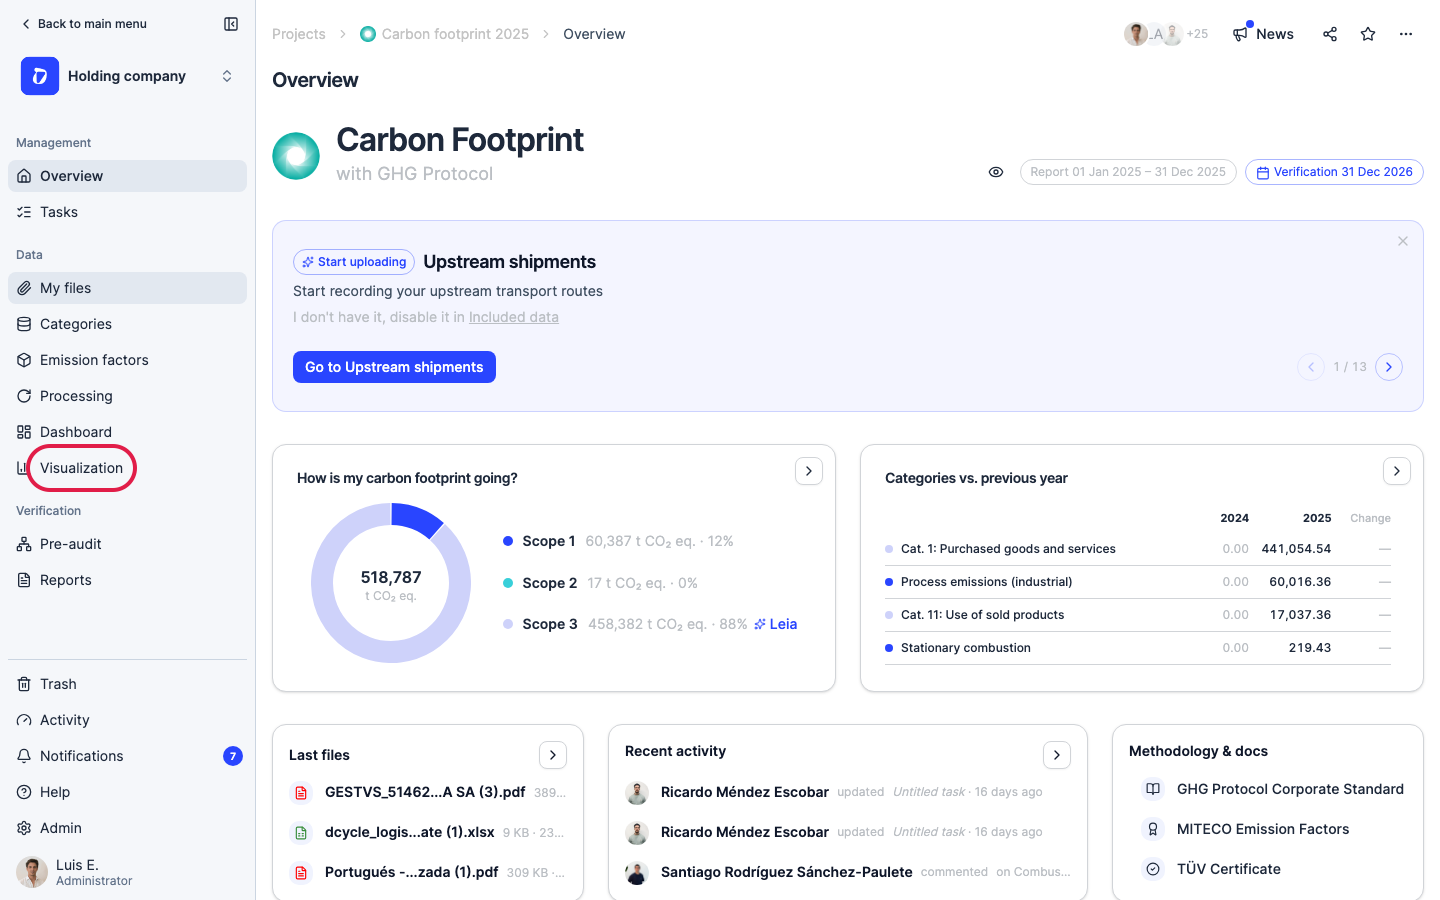
In the project menu, click “Visualization”.
Step 3
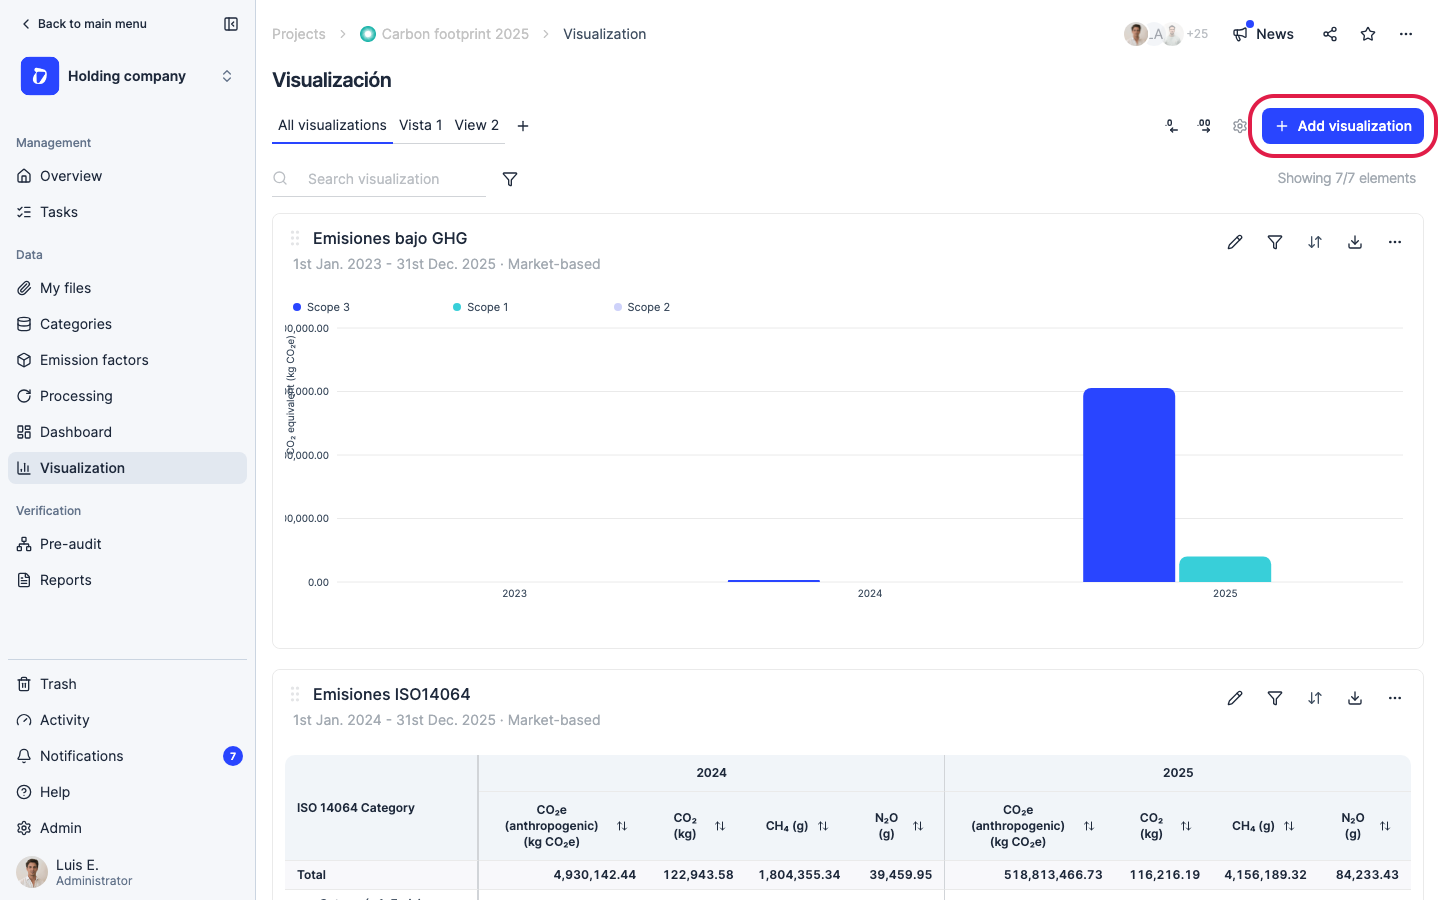
The Visualization page lists your charts and tables. Tabs across the top (“All visualizations” plus any custom views) group them. Each card shows its date range and calculation method (e.g. Market-based) and has its own actions on the right: edit, filter, sort, download and a ”⋯” more menu.
Step 4
Click “Add visualization” in the top-right.
Step 5
Choose how to build it. “Create from template” gives you ready-made charts — including a year-over-year comparison (“…vs previous year”). “Create custom” lets you build your own: pick a chart or pivot table, the metric (e.g. emissions by scope), and the data to include.

Step 6
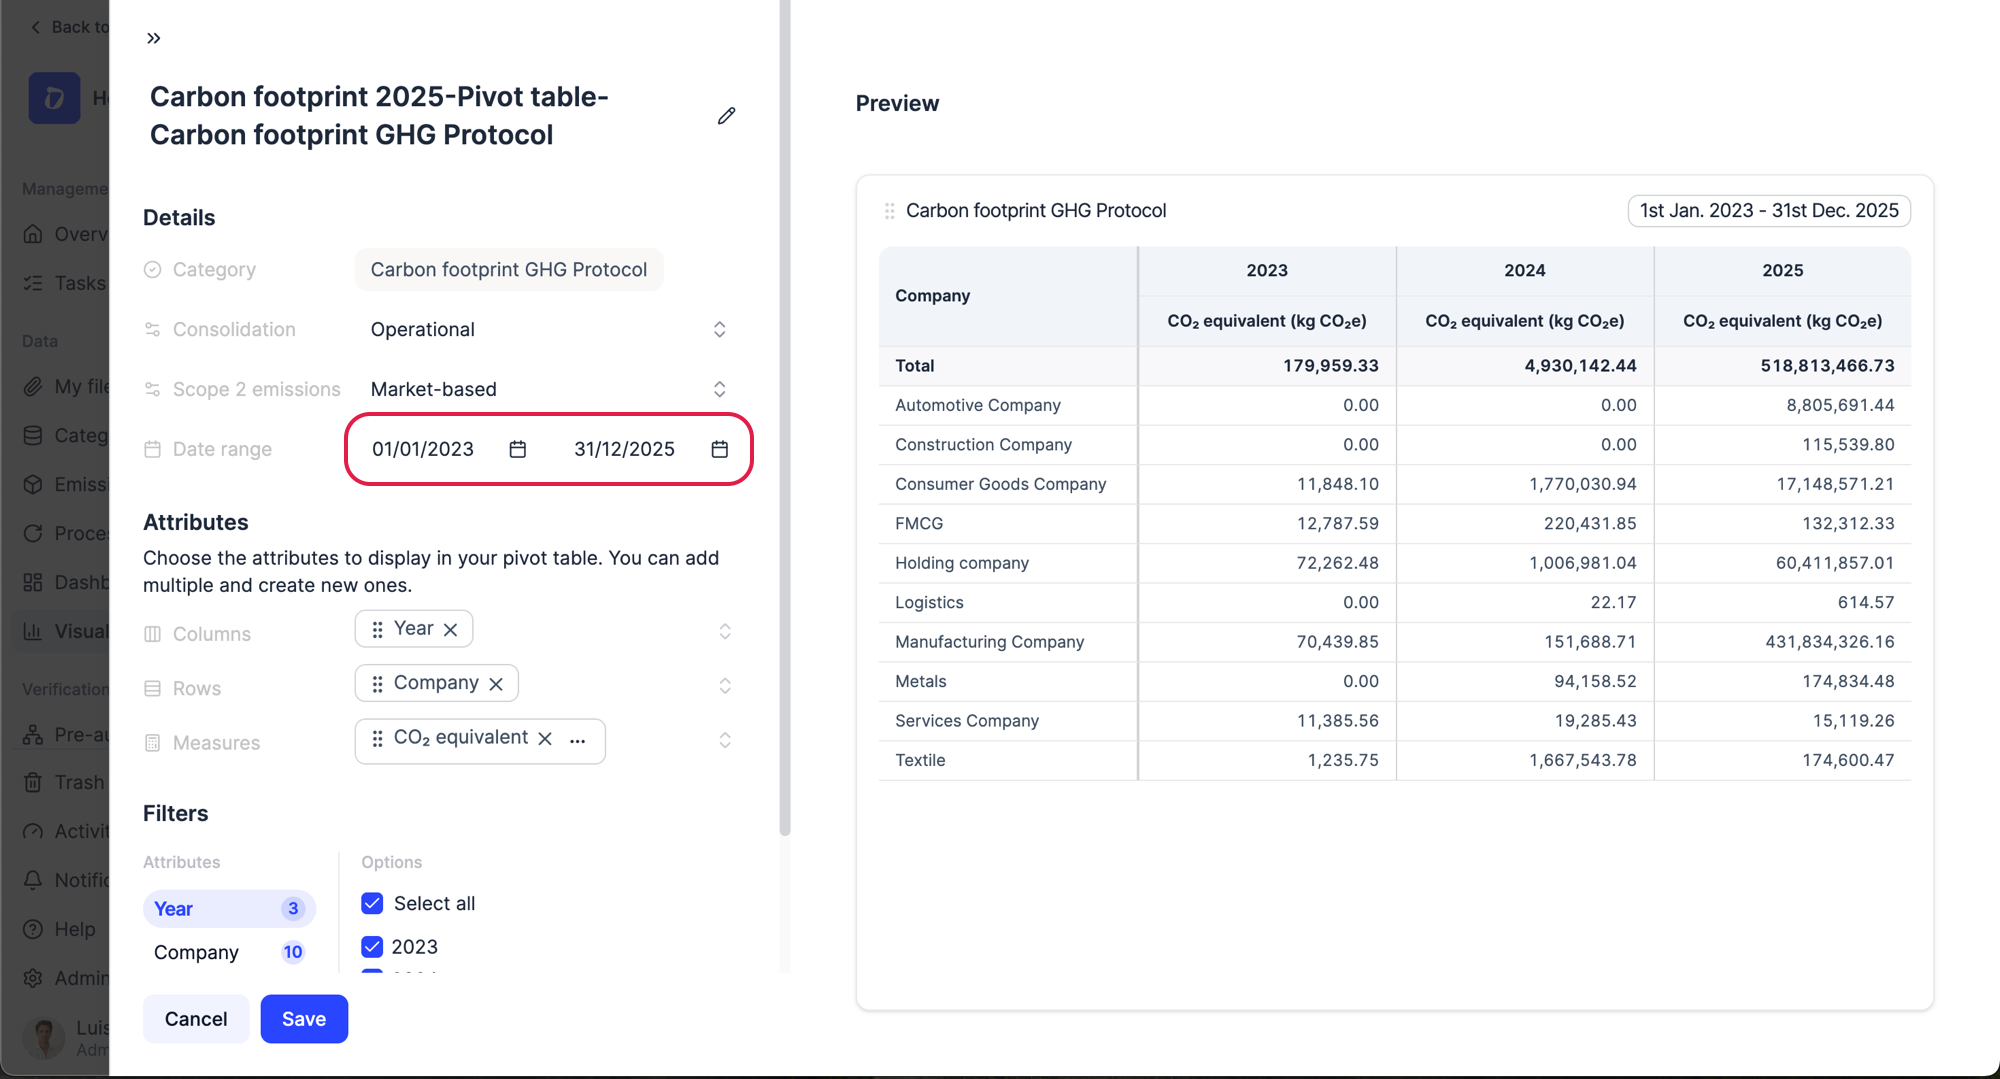
To compare years, set the visualization’s date range to span them. A bar chart then draws one bar per year, and a pivot table adds a column group per year — so the years sit side by side. The “vs previous year” template does this for you.
The example below is a pivot table: its date range (circled) drives the year columns — here 2023, 2024 and 2025 — shown in the preview on the right.
Step 7
Organize visualizations into tabs with each card’s ”⋯” menu → “Move to tab”, and duplicate or delete them from the same menu. Deletion is one card at a time — there’s no bulk delete — and deleted visualizations go to the project Trash, where you can restore them.
Step 8
If a card shows “Calculating data” or all zeros, the project is still processing — wait a moment and refresh. Persistent zeros usually mean no data matches the visualization’s period or filters, not an error.
Was this helpful?
What was missing or unclear? (optional)
Sent. Thank you for helping us improve.