Product Guides
Create a GHG report with the editable template
The Report Builder lets you create a fully customizable GHG report using a pre-built template. Edit the content, add charts and tables, and export a polished PDF or Word document — no design work needed.
Before you start
You need an Editor role in your Dcycle organization.
Steps
Step 1
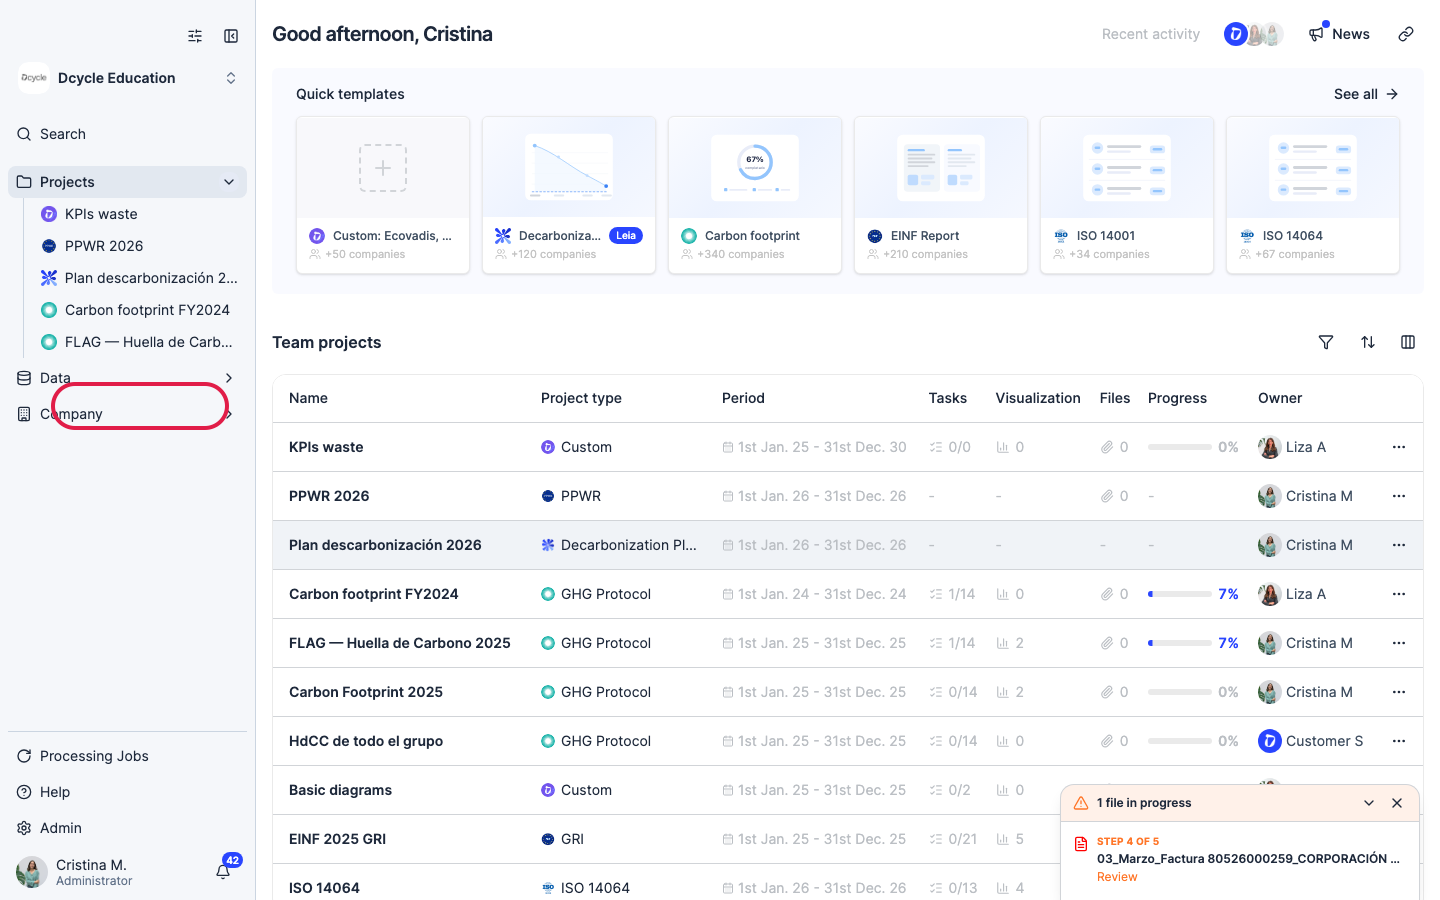
Open a GHG Protocol project from the home page.
Step 2
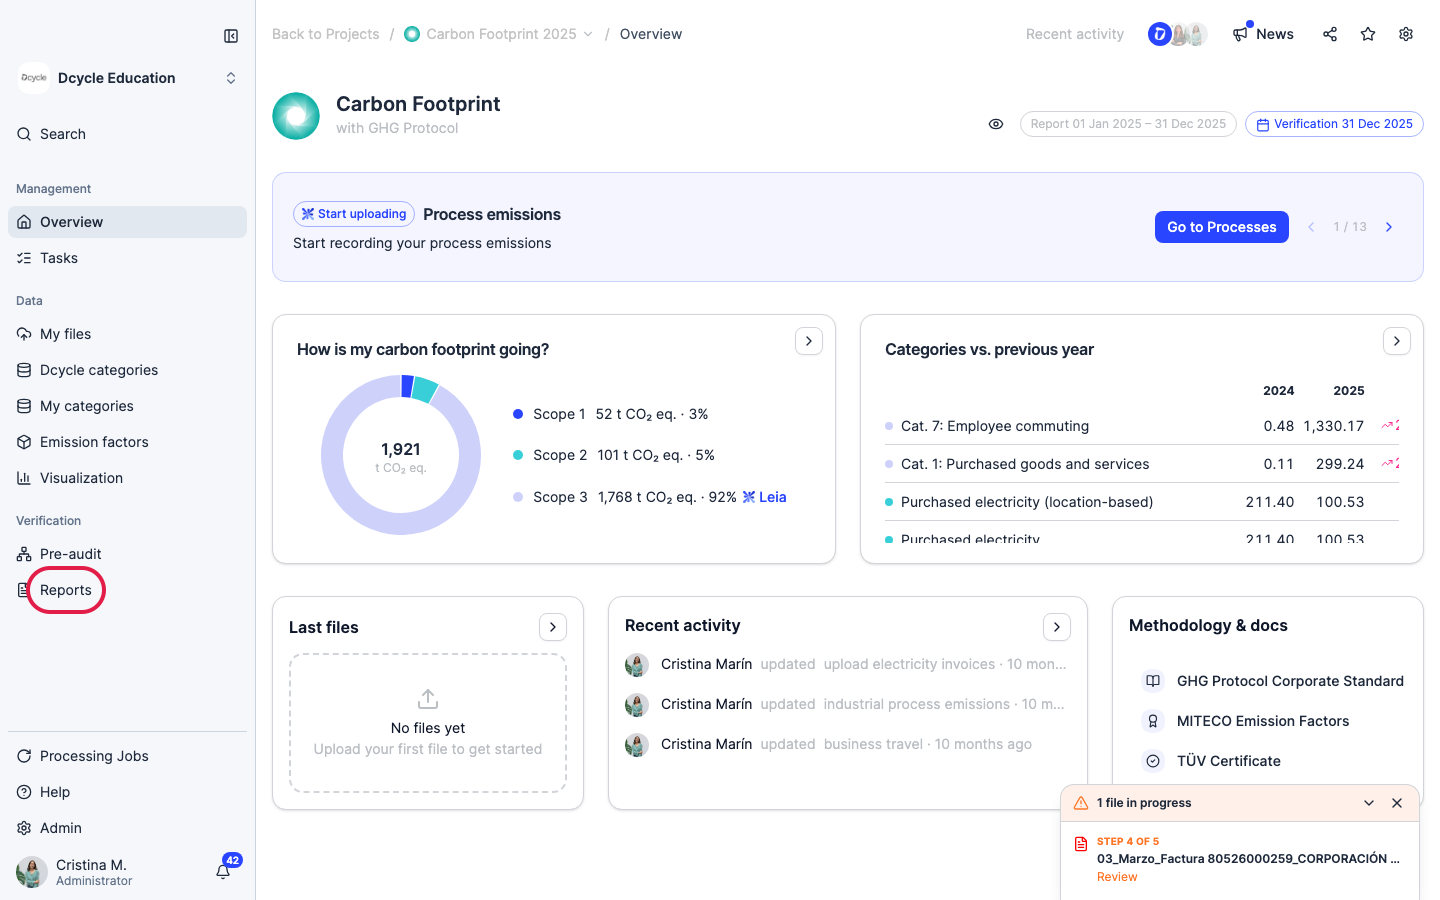
Click “Reports” in the left sidebar (under “Verification”).
Step 3
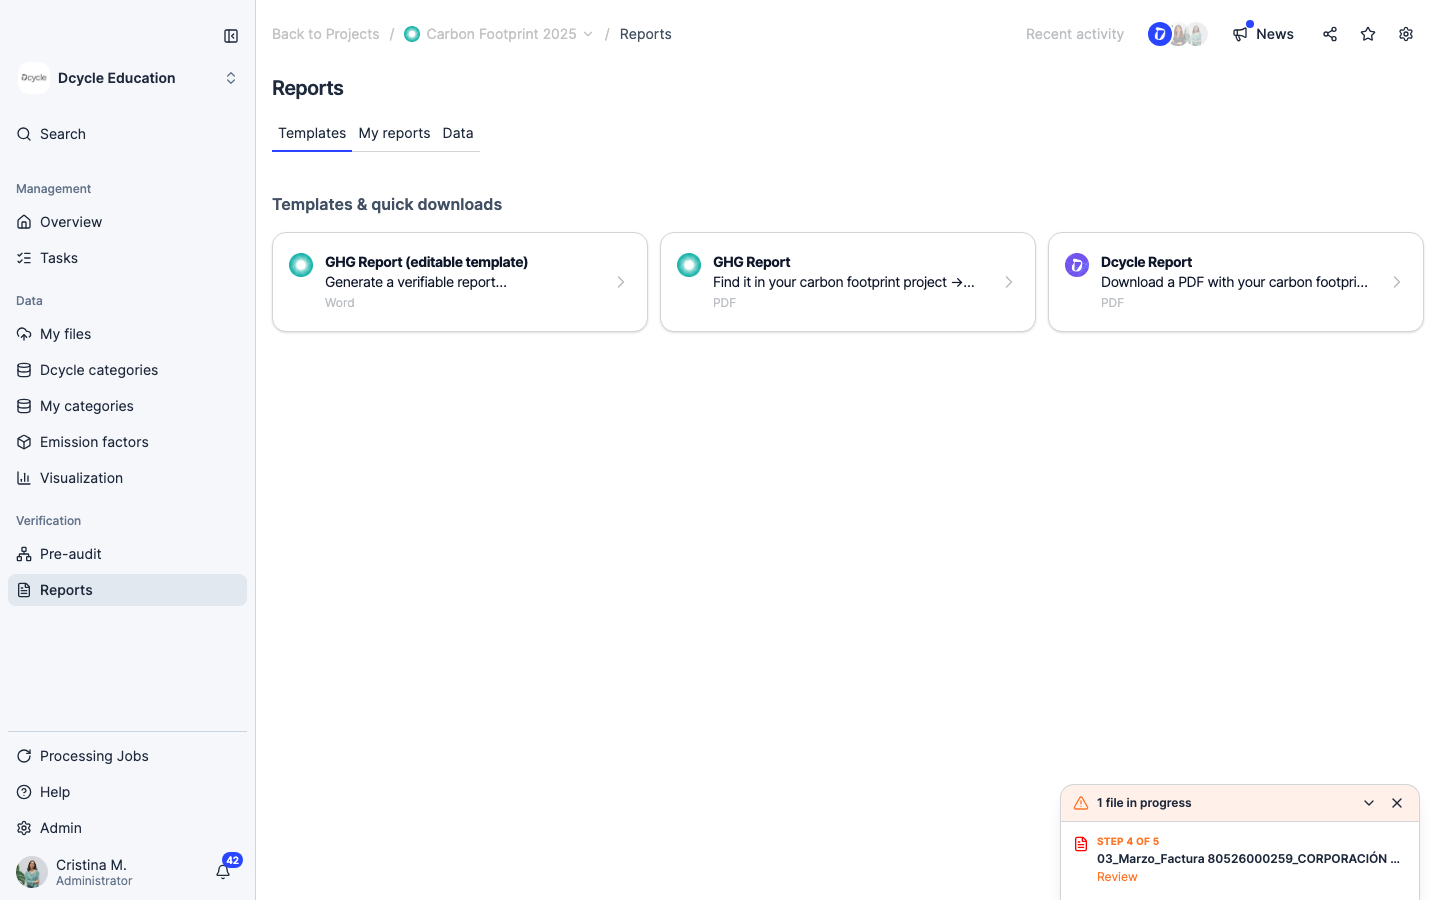
The Reports section shows three options under “Templates & quick downloads”. Click “GHG Report (editable template)” to open a fully customizable Word document that you can edit directly in Dcycle’s Report Builder.
Step 4
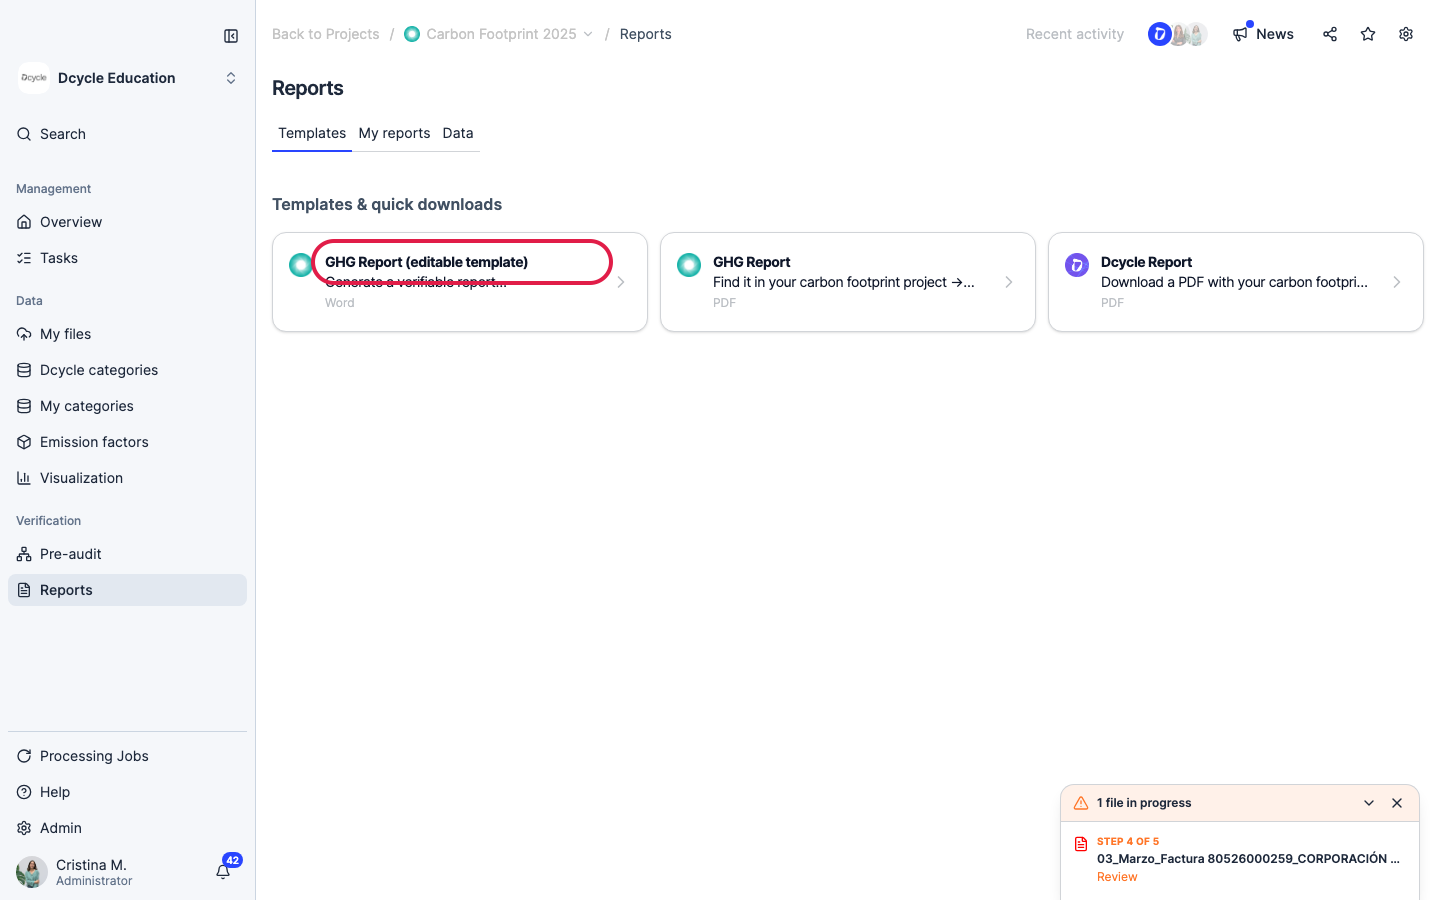
Click “GHG Report (editable template)”.
Step 5
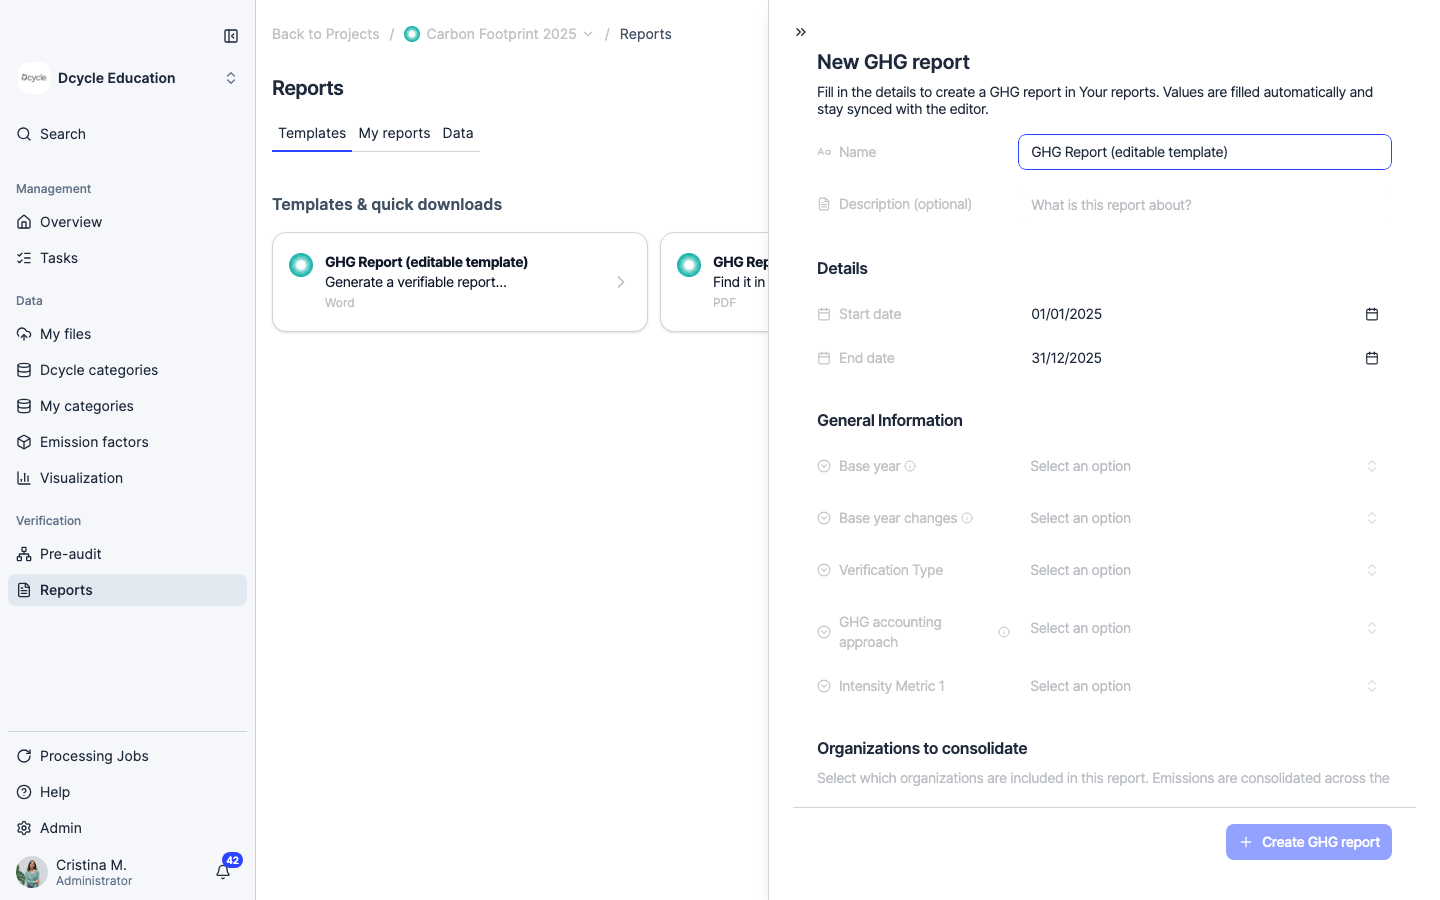
A panel opens on the right where you can name the report and set the reporting period (start and end date). You can also fill in general information fields like base year, GHG accounting approach, and verification type — these values are synced automatically into the document. When ready, click ”+ Create GHG report”.
Step 6
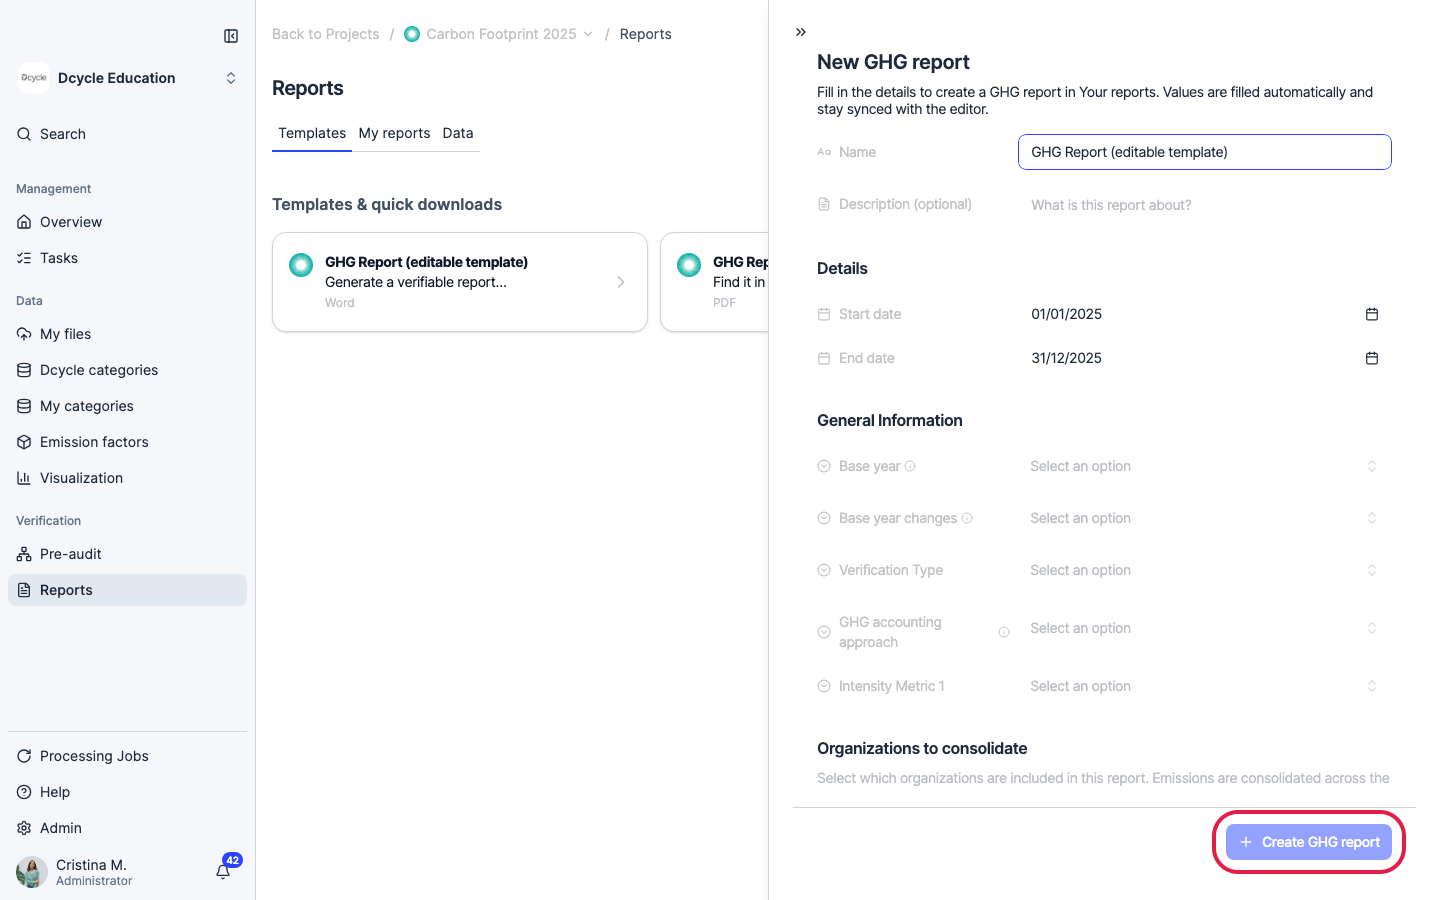
Once you’ve filled in the required fields, click ”+ Create GHG report”. The report is created instantly and opens in the Report Builder editor.
Step 7
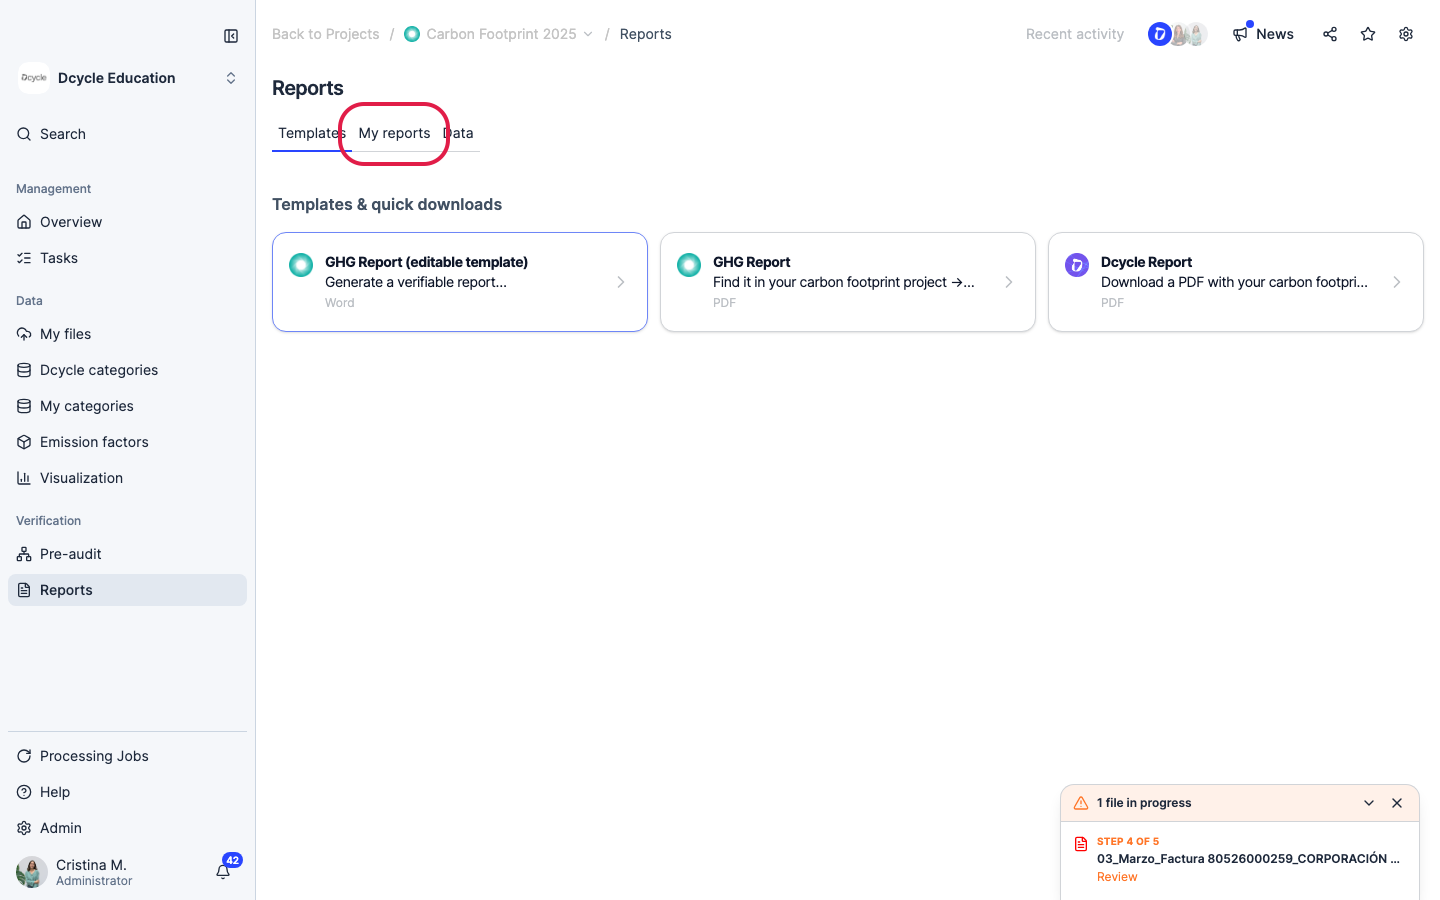
Once created, find all your editable reports under the “My reports” tab.
Step 8
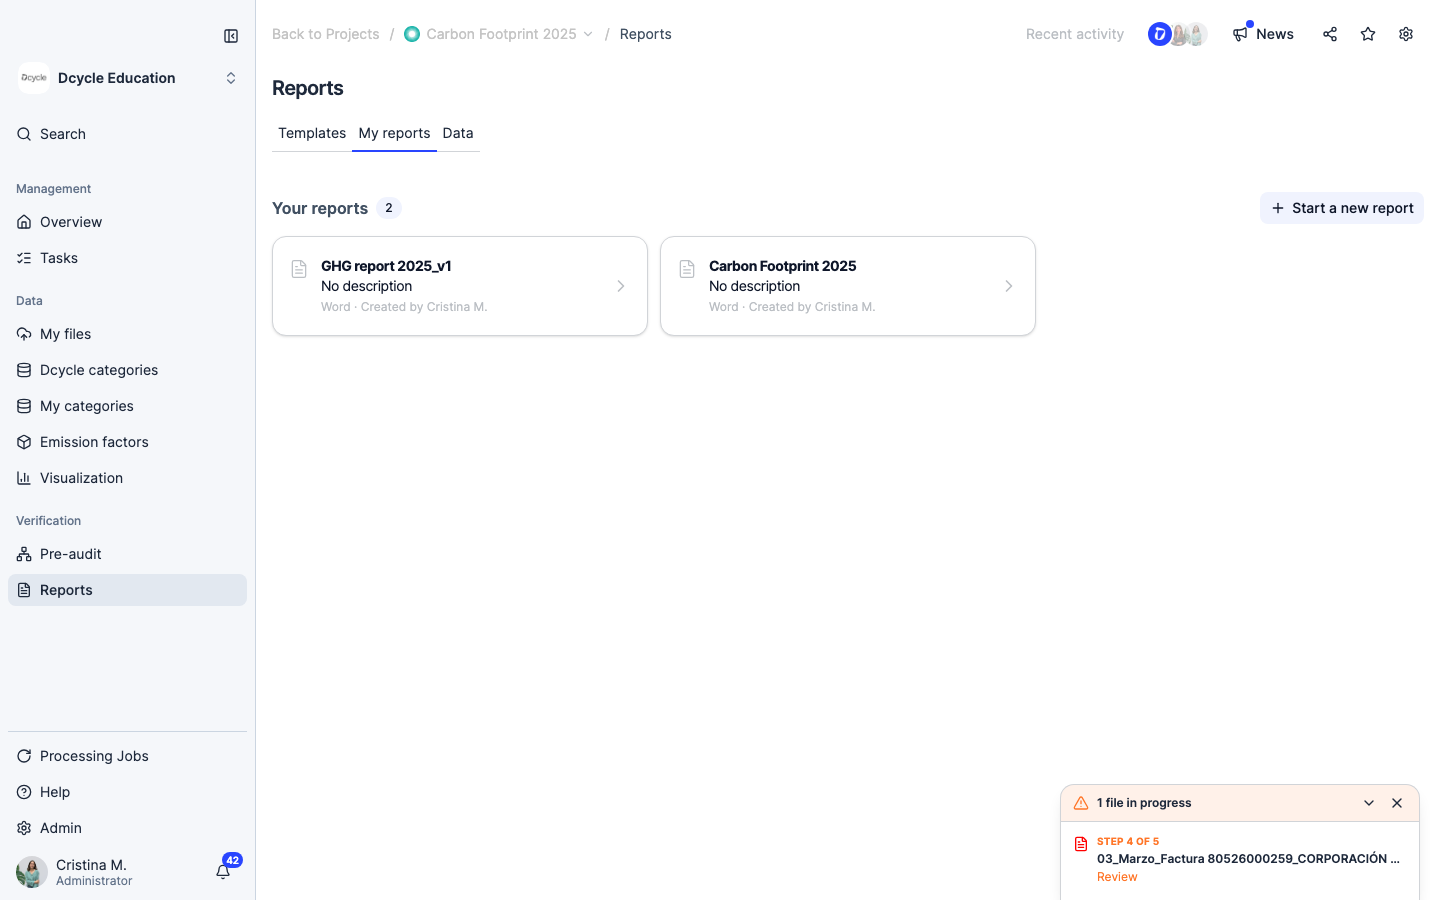
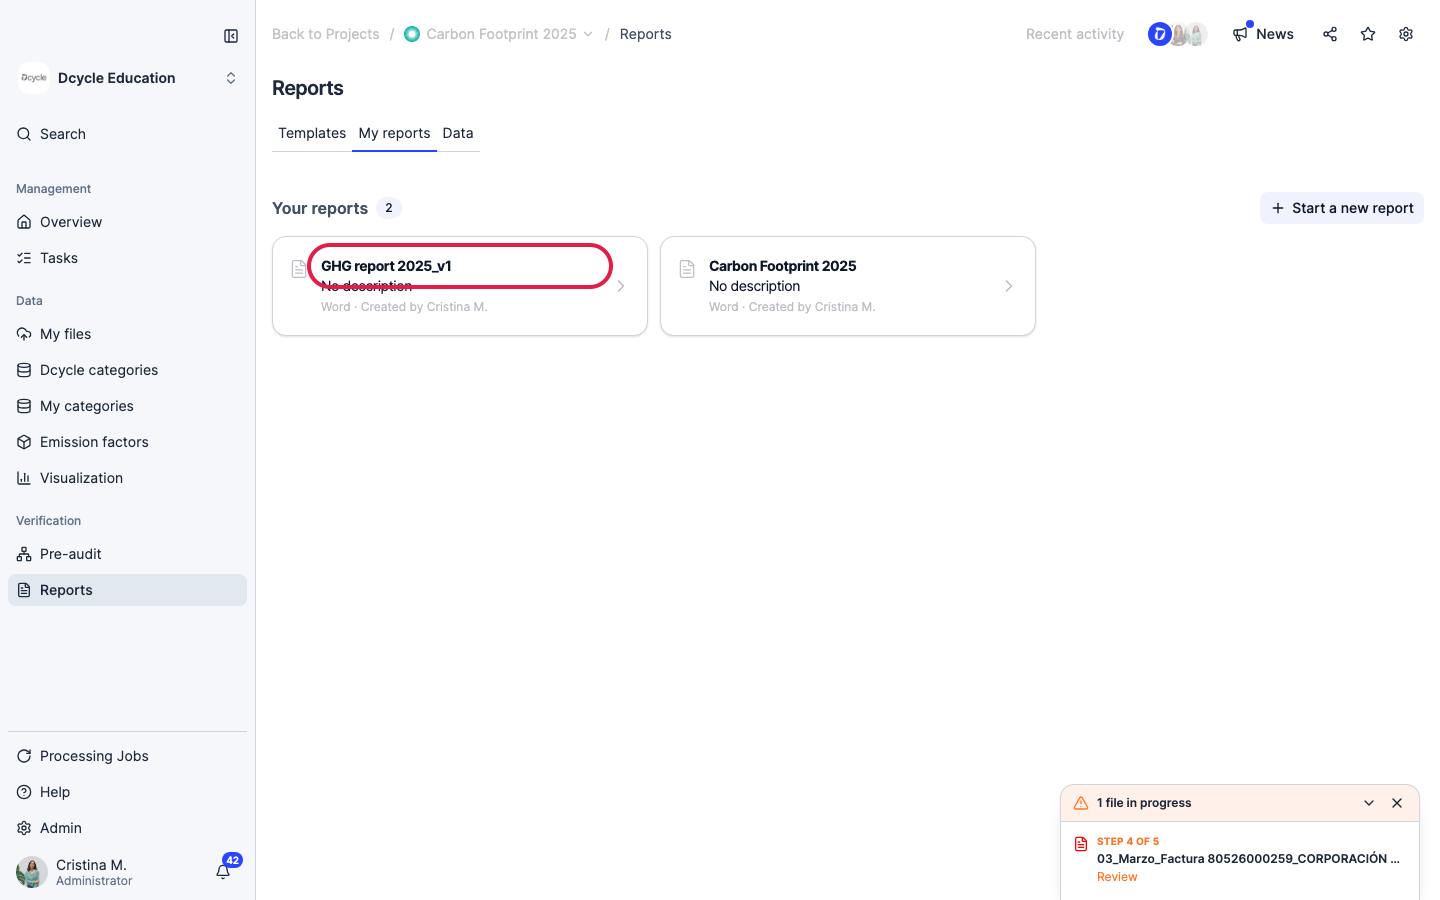
The “My reports” tab lists all reports you’ve created from the editable template. Click any report name to open it in the editor and continue editing.
Step 9
Click any report card to open it in the editor.
Step 10
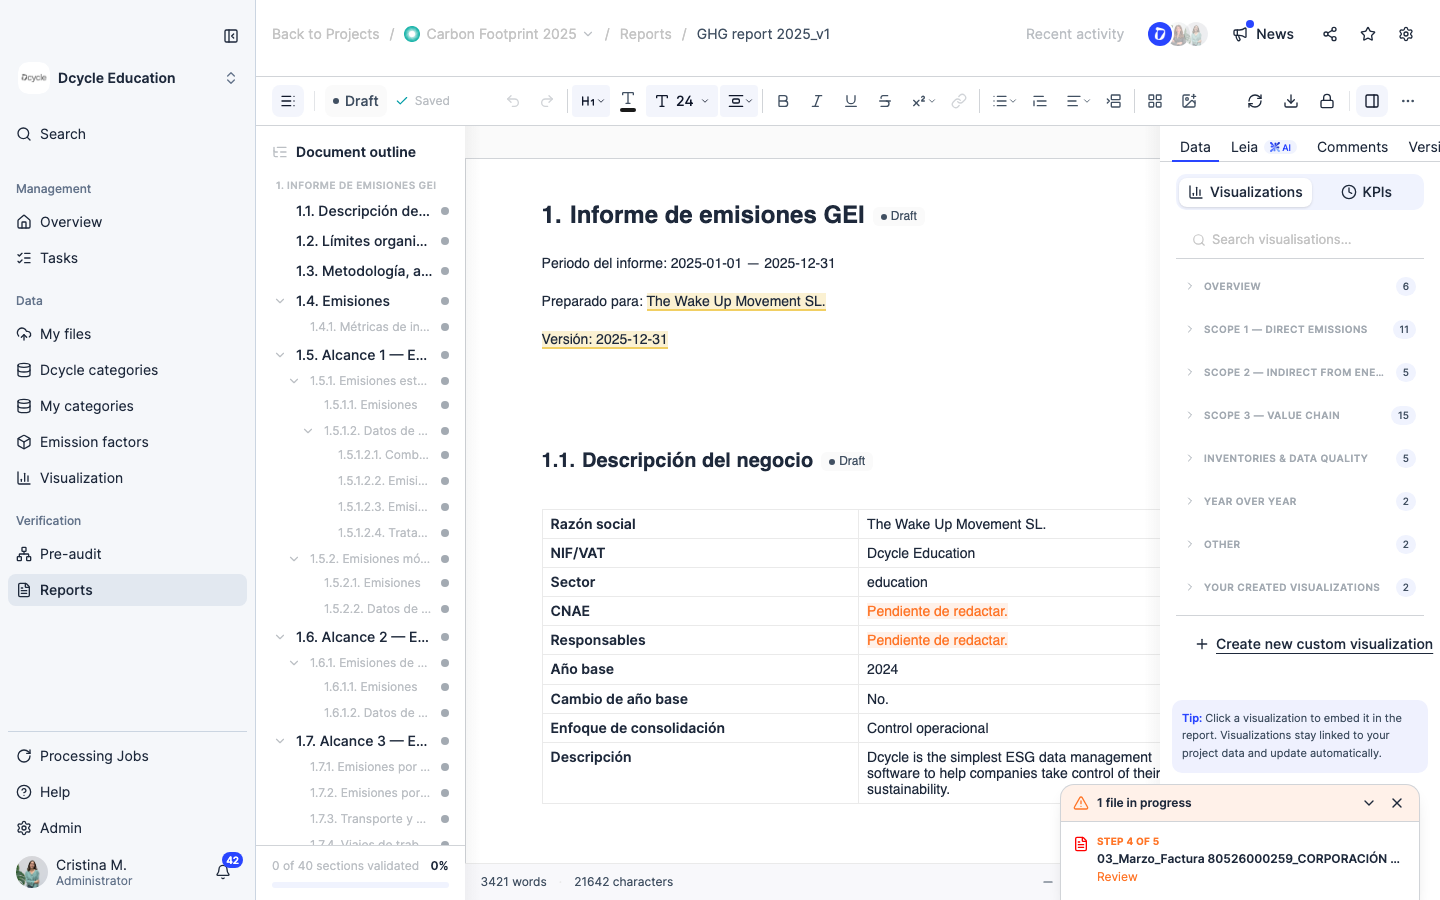
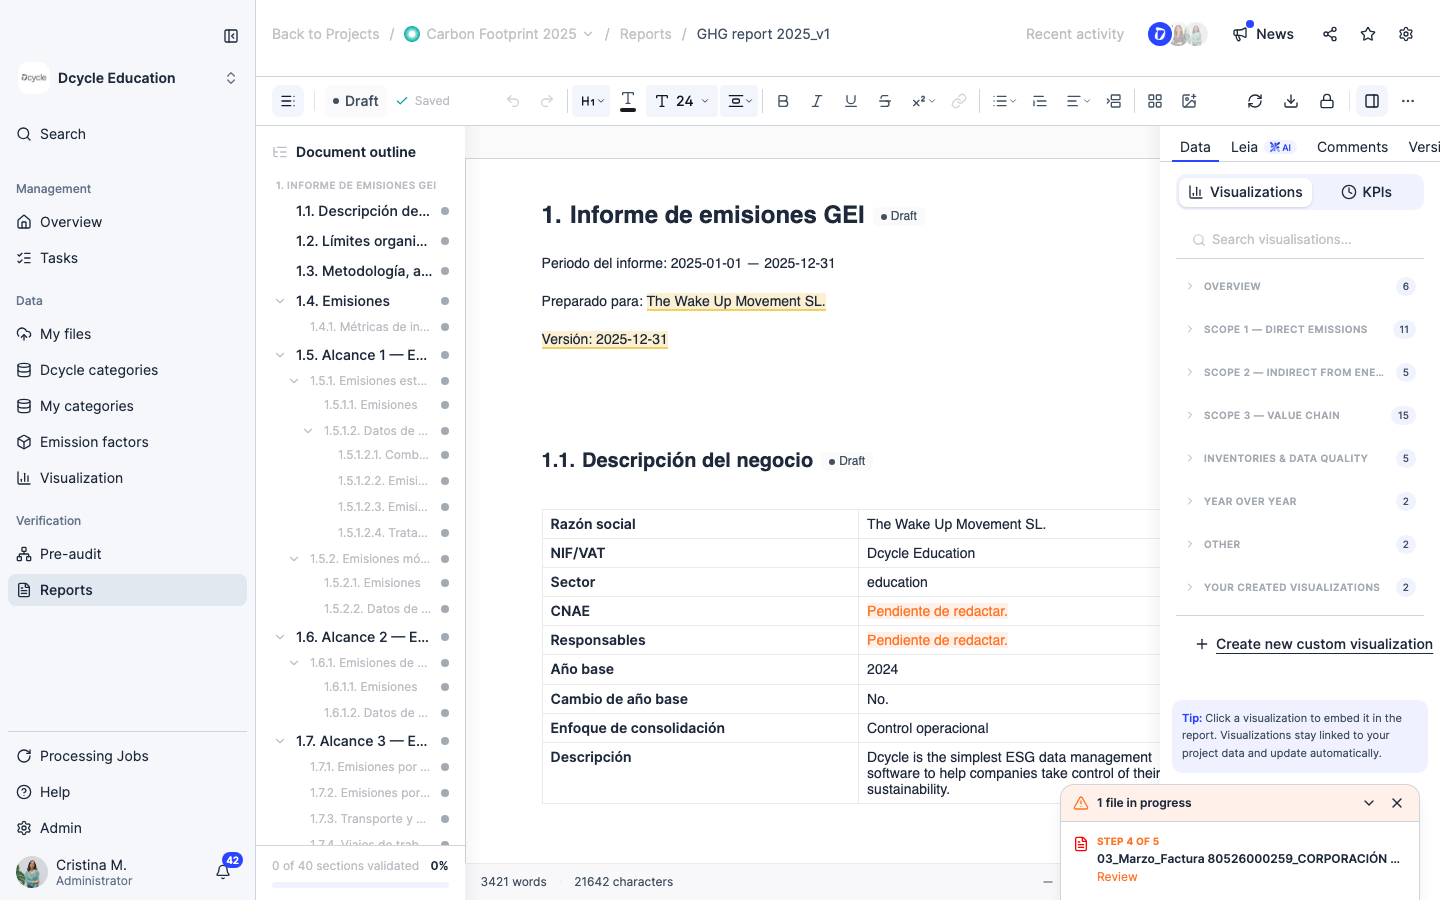
The Report Builder editor opens with the GHG template pre-filled with your data. The left panel shows the document index (table of contents) — click any section to jump to it. The main area is the editable document. All values (emissions totals, charts, tables) are synced automatically from your Dcycle project data.
Step 11
Click anywhere in the document to start editing. Replace or add narrative text, resize or reposition charts, and delete any section you don’t need. Visualizations (bar charts, donut charts, line graphs) are embedded as live elements — they stay visual in both PDF and Word exports, without turning into plain tables.
Step 12
To start a new page at any point, place your cursor where you want the break and click the page break option in the toolbar. This is ideal for separating chapters or sections so each starts on a fresh page in the exported document.
Step 13
When the report is ready, click the download icon in the top-right corner of the editor. Choose PDF for a print-ready file, or Word (.docx) if you need to make further edits outside Dcycle. Charts and visualizations are preserved in both formats. If a table is too wide for the page, a warning appears — click “Fit to page” to resize it automatically before exporting.
Was this helpful?
What was missing or unclear? (optional)
Sent. Thank you for helping us improve.