Product Guides
Create custom KPIs and collect values from your organization
Custom KPIs let you define your own indicators — water use, waste, certifications, anything — and collect their values from data owners across your organization through periodic campaigns. This guide shows how to create a KPI group, define campaigns, and track responses.
Before you start
You need an Editor role in your Dcycle organization.
Steps
Step 1
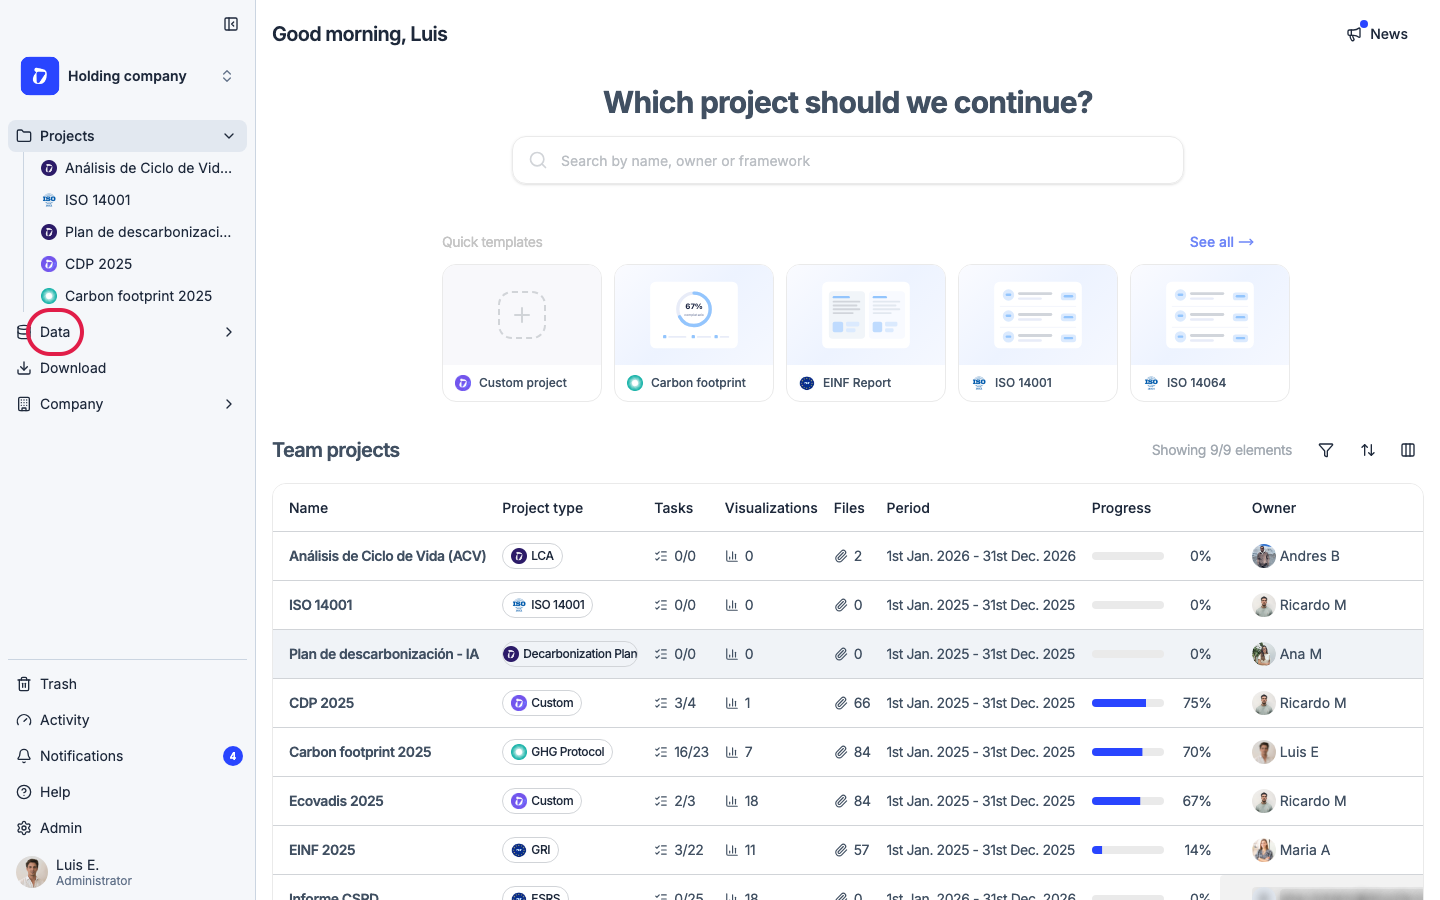
Click “Data” in the left navigation to open the categories page.
Step 2
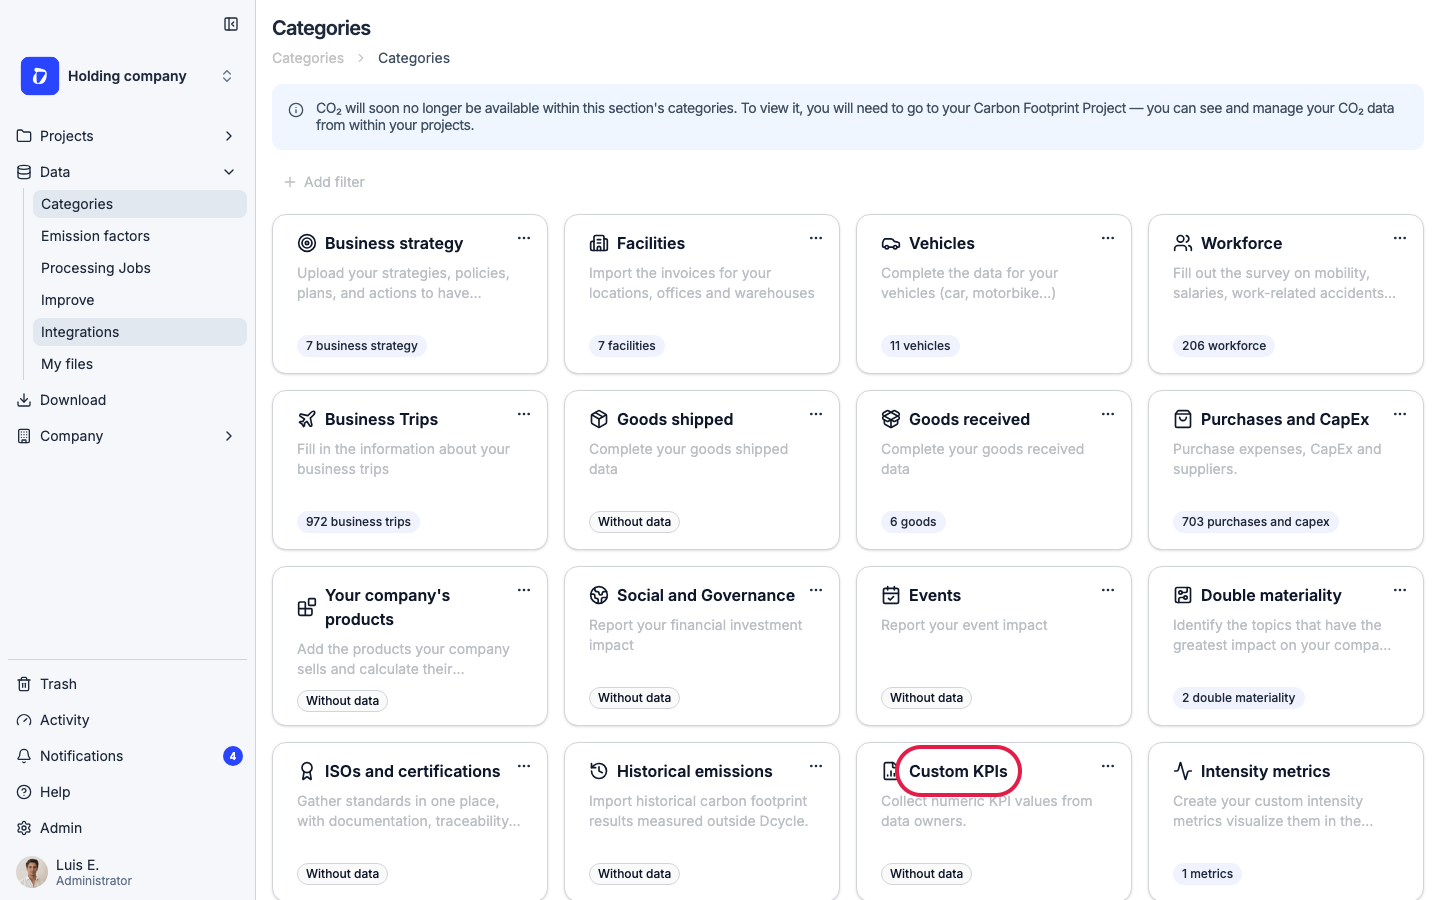
Find the “Custom KPIs” card among the data categories and click it.
Step 3
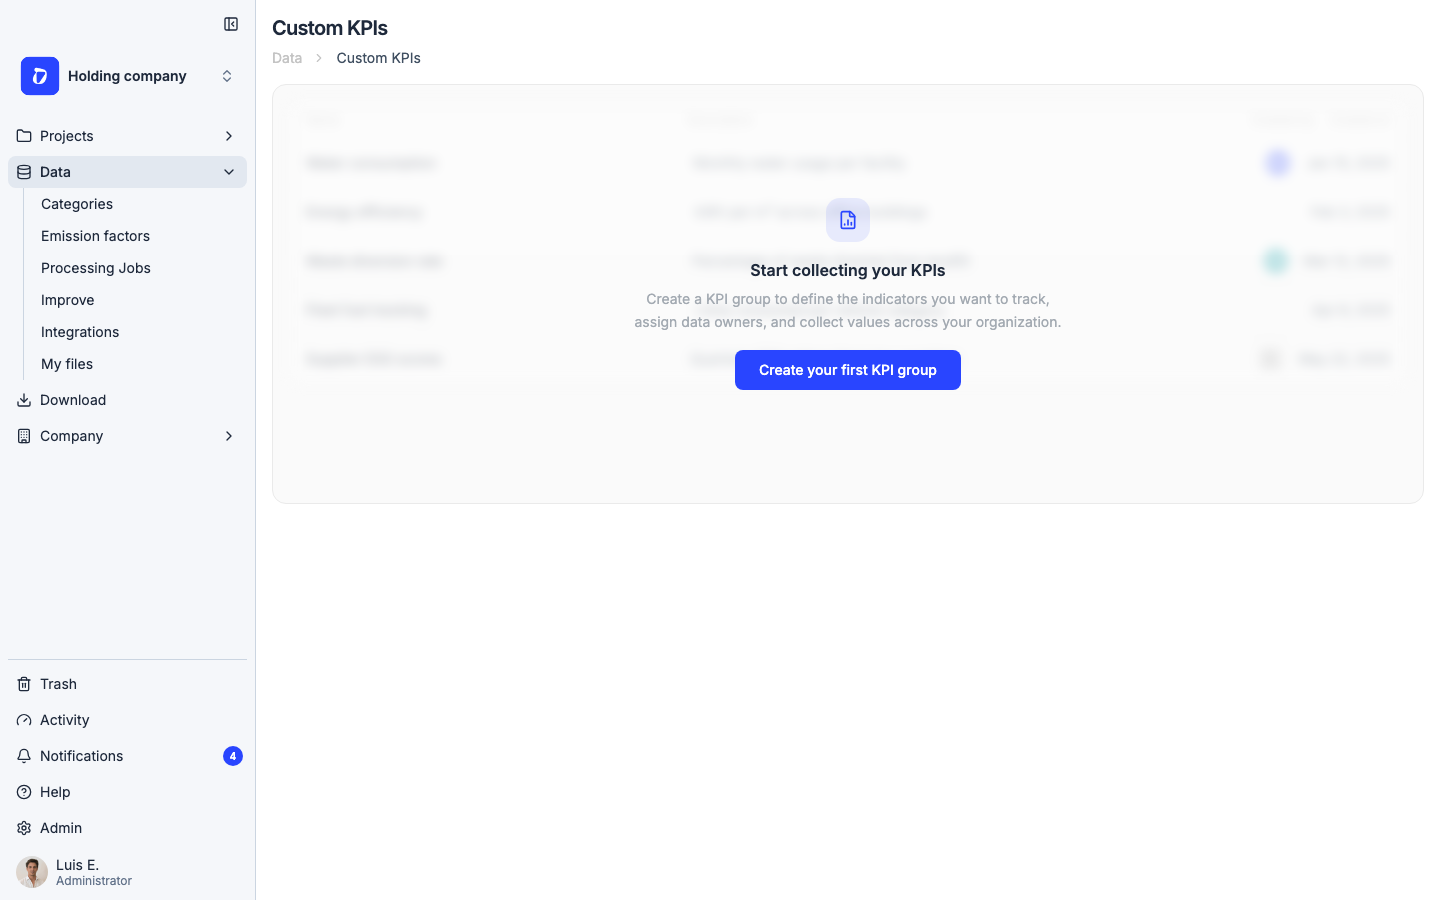
The Custom KPIs page lists your KPI groups. A KPI group bundles related indicators (for example “Water consumption per facility”) together with the campaigns that collect their values. If you haven’t created any yet, you’ll see the empty state shown here.
Step 4
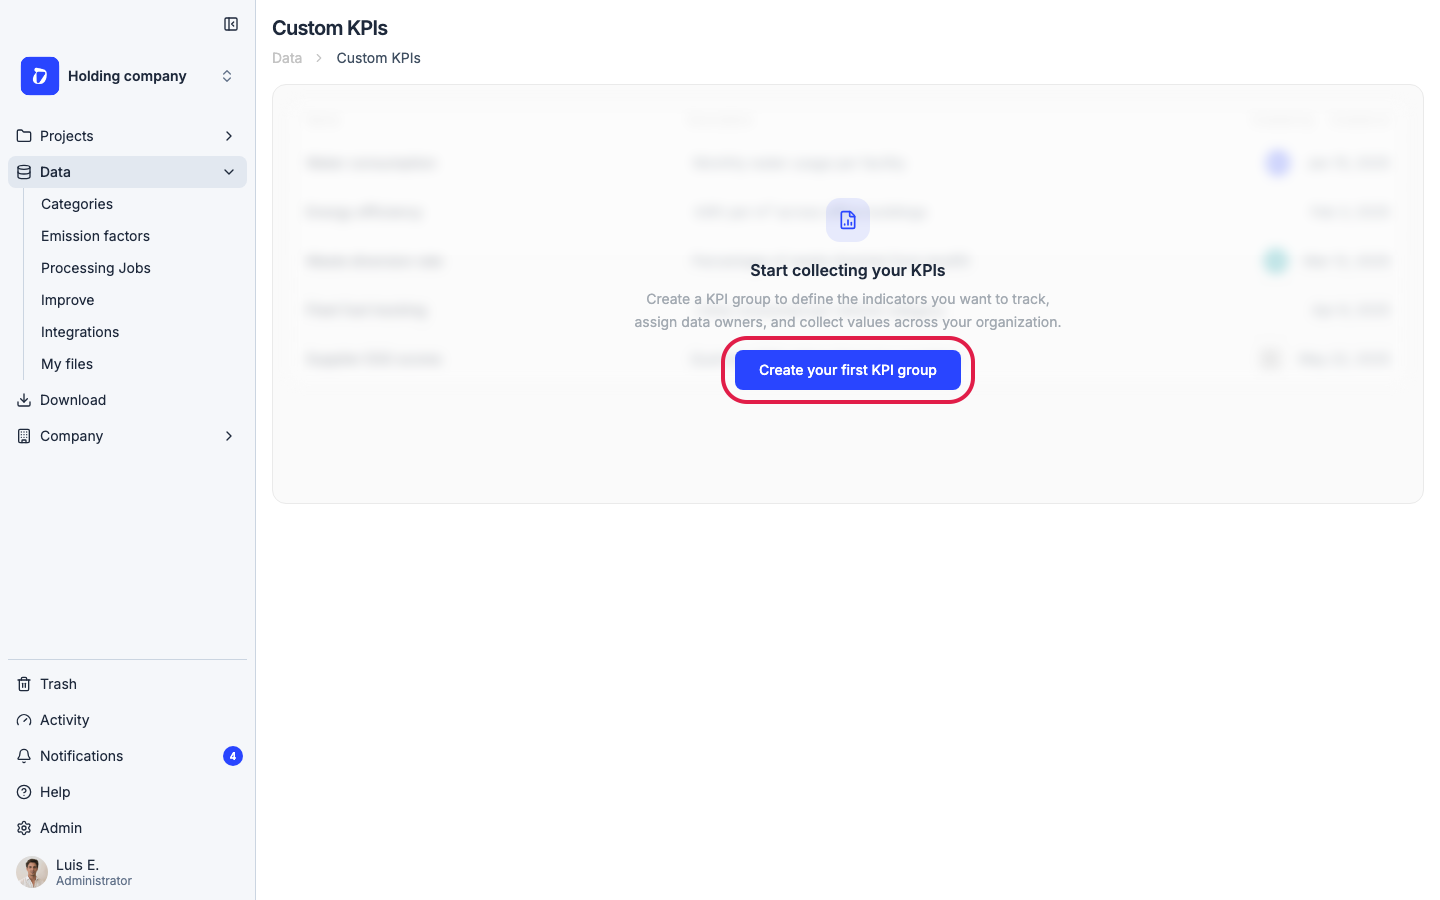
Click “Create your first KPI group”. If you already have groups, use the “New KPI group” card and click “Create” instead.
Step 5
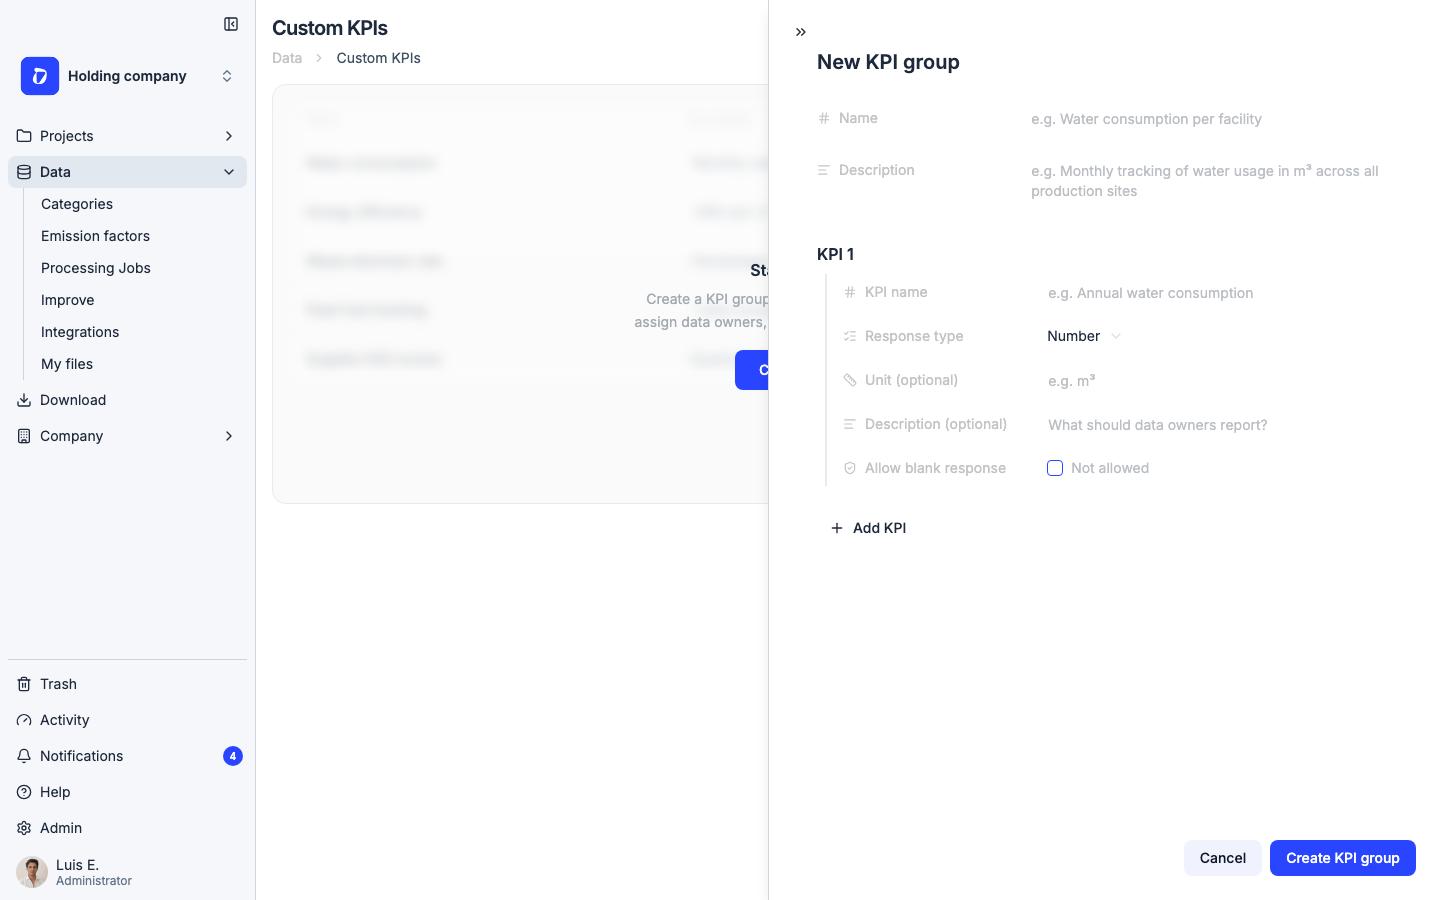
Give the group a “Name” (e.g. “Water consumption per facility”) and an optional “Description”. Then define the indicators under “KPIs”: click “Add KPI” for each one and set its name, an optional description and unit (e.g. m³), and the “Response type” — Number, Text, Percentage, Date or Yes / No. Enable “Allow blank response” if data owners may skip it.
Step 6
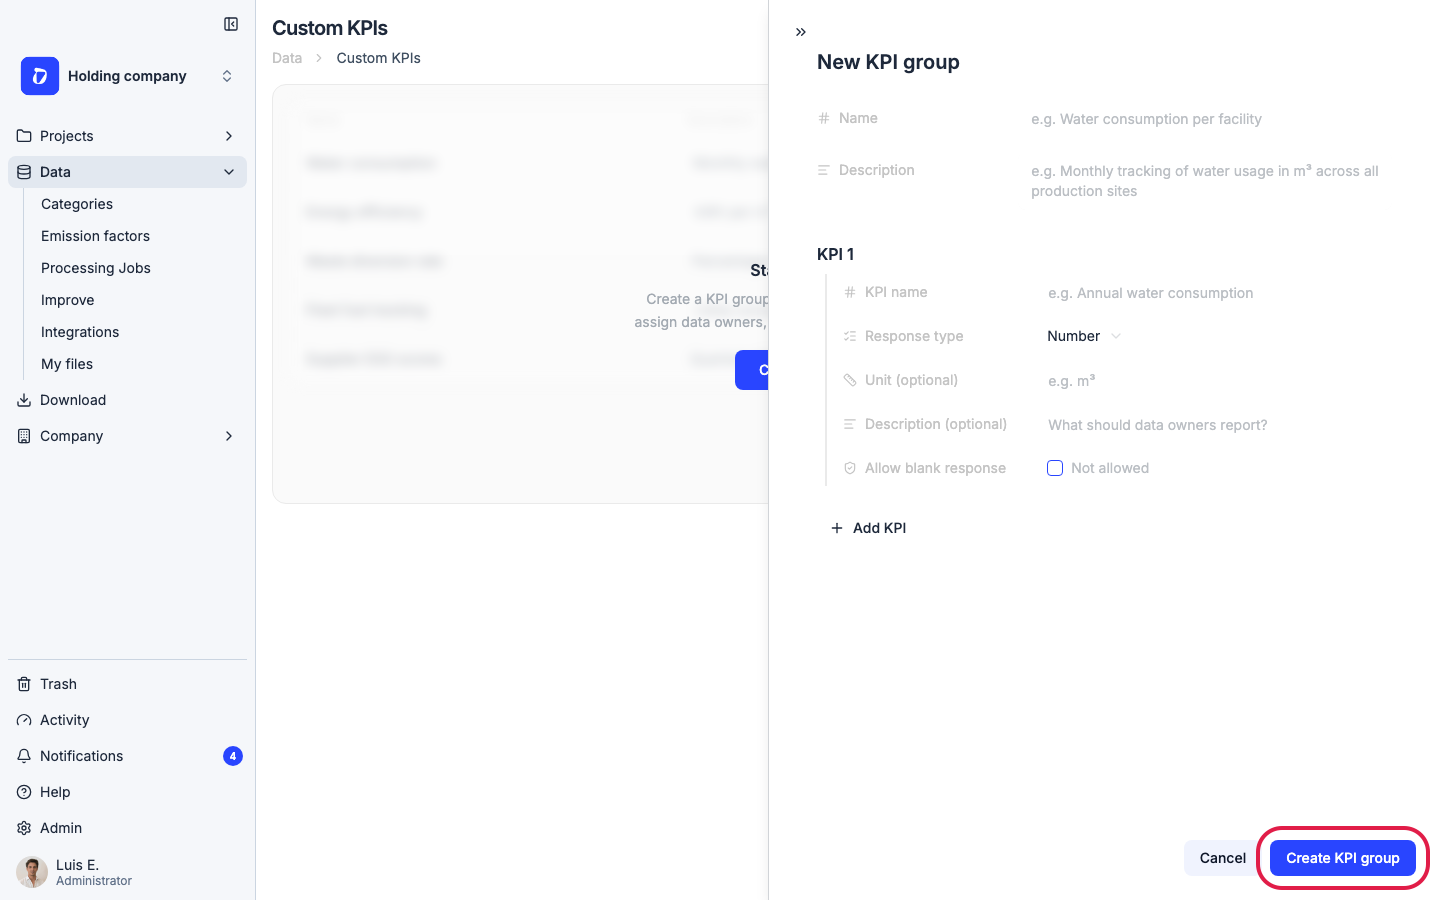
When you’re done, click “Create KPI group”. You’ll land on the group’s page, where you can keep refining the KPI list later with “Manage KPIs”.
Step 7
Values are collected through campaigns. On the group’s page, open the “Configuration” tab and click “New campaign”: give it a name, a period (start and end) and a deadline. Dcycle sends automatic reminders to data owners at fixed offsets before the deadline.
Step 8
Inside the campaign, click “Add data owner” to assign who reports each organization or facility — an internal member or any external email. Then select the data owners and click “Send survey”: each one receives a magic-link form to submit their values, no Dcycle account needed. Use “Resend survey” for anyone who hasn’t answered.
Step 9
Track progress from the campaign table — each data owner shows as Awaiting, Partial or Completed. Submitted values appear in the “Responses” tab, with any evidence attachments; you can also add or edit values manually and check each value’s history. When the collection cycle ends, use “Lock campaign” to prevent further changes.
Was this helpful?
What was missing or unclear? (optional)
Sent. Thank you for helping us improve.