Product Guides
Find your way around "Data to report"
"Data to report" is the working surface of the EINF: every item the report needs, grouped by category, each with its own status and owner. This guide shows how to read it and where to start.
Before you start
You need an Editor role in your Dcycle organization.
Steps
Step 1
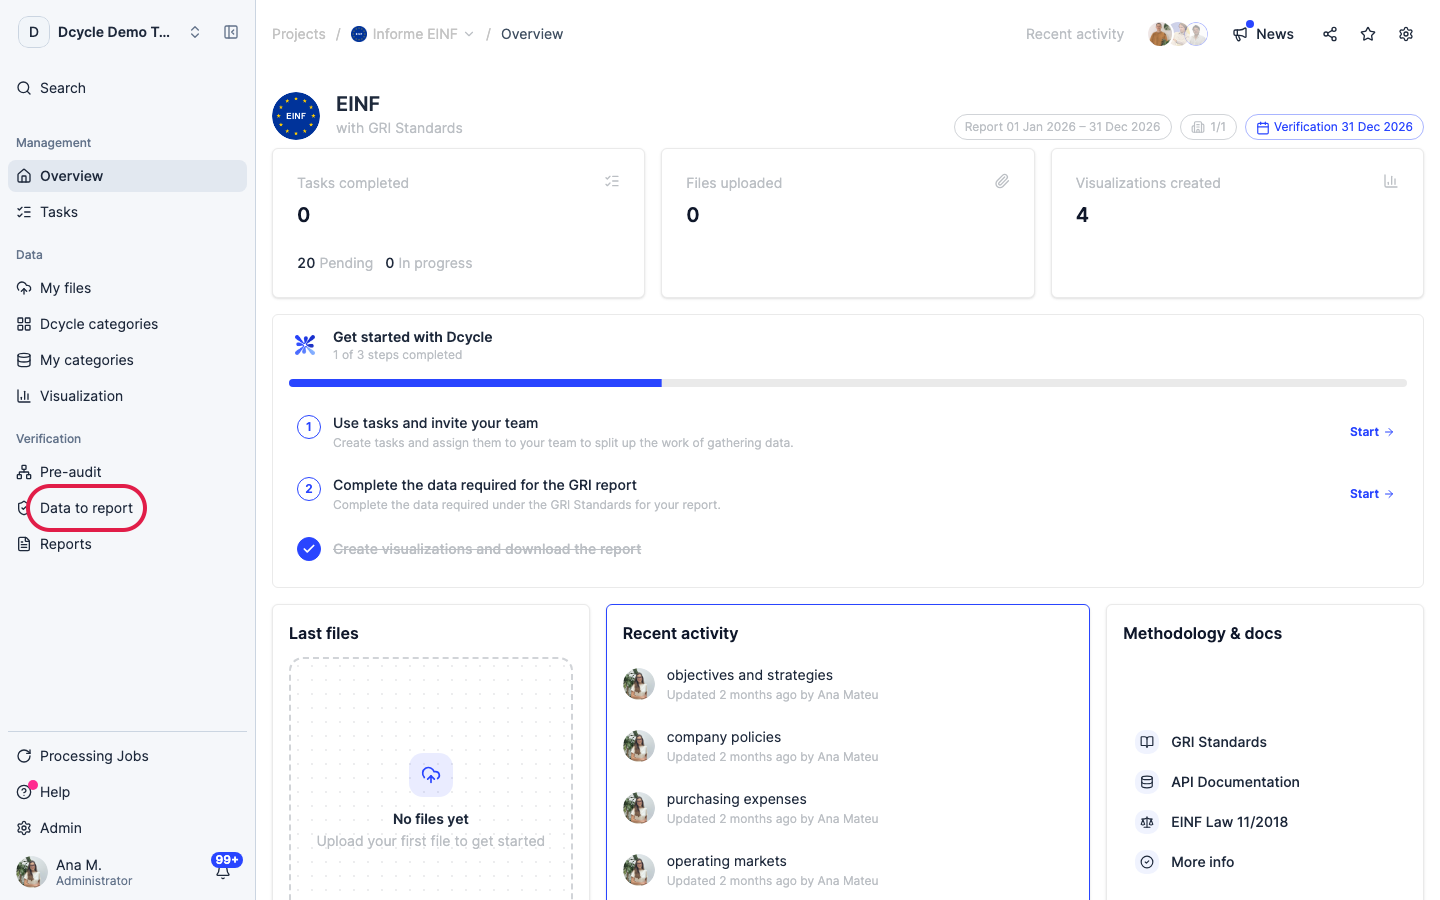
In the project menu, click “Data to report”. This is not the same as the “Data” group above it — that one is where raw files and consumption data live.
Step 2
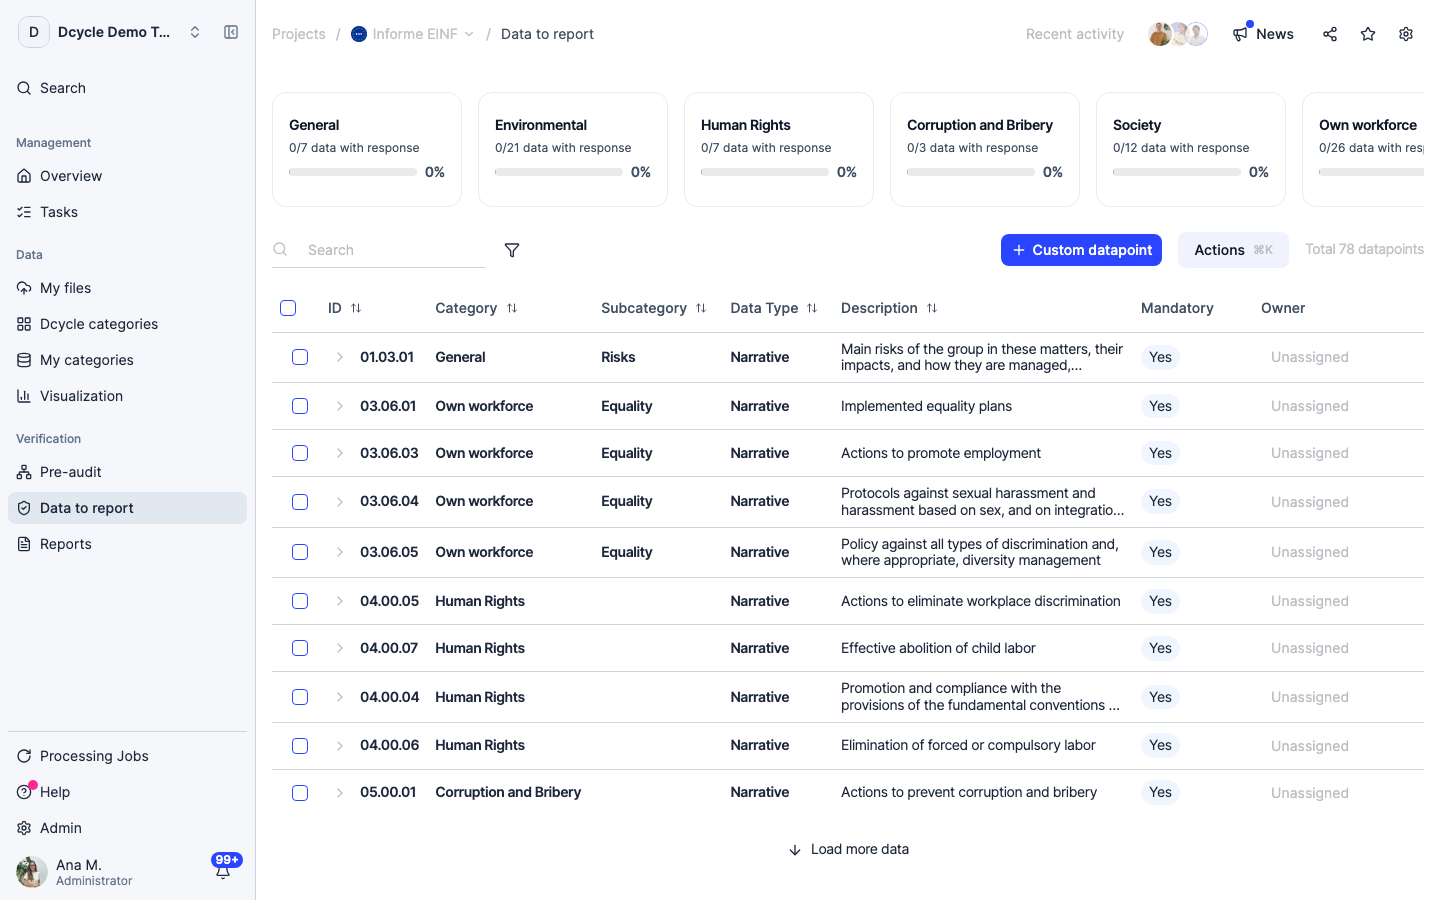
The cards across the top are the report’s categories — General, Environmental, Human Rights, Corruption and Bribery, Society and Own workforce — each with its own “x/y data with response” counter and percentage. They are your real progress bar: the project is finished when these are full, not when your files are uploaded.
Step 3
The table below lists every item: its ID (e.g. 02.04.04), category and subcategory, data type, description, whether it is mandatory, and its owner. The ID is the same in both interface languages, so use it when you are coordinating with someone by email or chat.
Step 4
Two data types share the list. “Narrative” items are answered by writing the policy, procedure or explanation yourself. “Quantitative” items are answered with a figure, by attaching a visualization built from your uploaded data. Sorting by the “Data type” column splits the work cleanly between the person who writes and the person who has the data. And if your organization already runs a carbon footprint project, the environmental quantitative items need no new data at all — the records are already in Dcycle, waiting for a visualization.
Step 5
The table loads in batches — use “Load more data” at the bottom, the search box, or the filter icon to reach an item instead of scrolling blindly. The counter on the right (“Total 78 data”) tells you how many items this report has in all.
Was this helpful?
What was missing or unclear? (optional)
Sent. Thank you for helping us improve.